

Are you constantly wondering what truly captures your website visitors' attention? Do you wish you had a clear picture of exactly where they click, where they hesitate, and what content they ignore? Without this crucial insight, optimizing your site often feels like navigating in the dark, leading to missed opportunities for growth and conversion.
Many businesses invest heavily in driving traffic but struggle to convert that traffic into tangible results. The disconnect often lies in not truly understanding visitor intent and behavior once they land on your pages. This is where the power of Website heatmap analysis becomes invaluable – it offers a visual representation of your users' interactions, turning abstract data into actionable insights.
Imagine seeing your website through the eyes of your visitors, literally. Heatmaps provide just that, illuminating the hot and cold spots of your pages. By leveraging these powerful website optimization tools, you can stop guessing and start making informed, data-driven decisions that directly impact your site's effectiveness and ultimately, your bottom line. Bornneo.Lab specializes in helping businesses like yours unlock this potential, transforming raw visitor data into strategic advantages.
READ ALSO: Using 'Headless' Technology to Make Your Website Faster and Stronger
Unveiling the Power of Heatmaps: What Are They and Why Do They Matter?

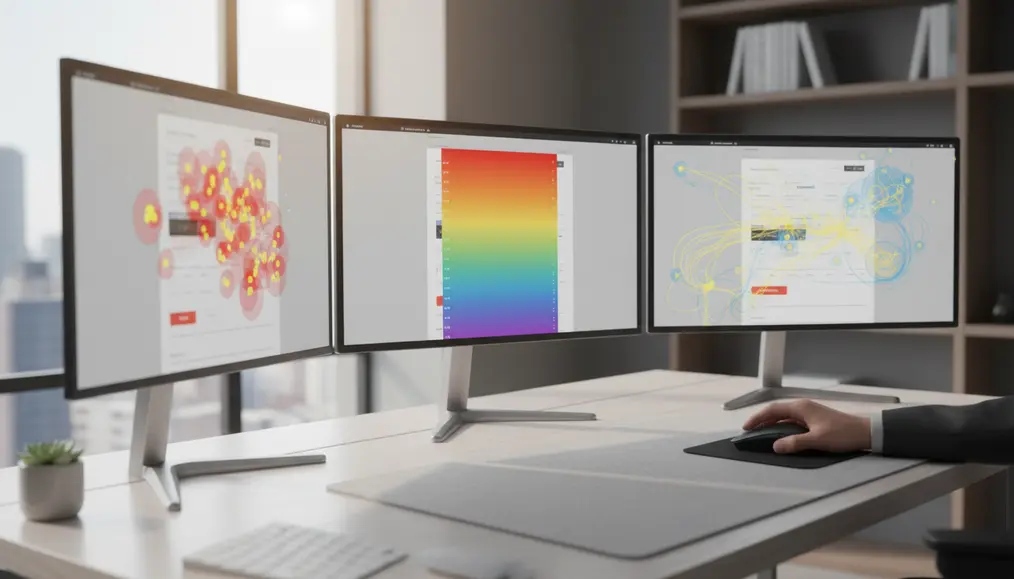
At its core, a heatmap is a graphical representation of data where values are depicted by color. In the context of web development and digital marketing strategy, heatmaps are powerful visual analytics tools that show where users click, move their mouse, and scroll on a webpage. Think of it as a weather map for your website, with "hot" colors (red, orange) indicating high activity or engagement, and "cold" colors (blue, green) showing less interaction. This type of user behavior tracking is foundational for any serious attempt to improve website conversion and enhance the overall user experience (UX).
The significance of heatmaps extends beyond mere curiosity. They provide undeniable evidence of how users interact with your content, elements, and calls to action. Without heatmaps, you might assume users see your important information, but a scroll map might reveal that most never make it past the first fold. You might think a button is prominent, but click tracking could show it's rarely engaged. These tools are critical for moving past assumptions and into a realm of precise, data-backed improvements, allowing you to understand user behavior on website more thoroughly.
Types of Heatmaps and Their Unique Insights
While often grouped under the general term "heatmap," there are several distinct types, each offering a unique lens into user behavior tracking. Understanding these differences is key to conducting comprehensive Website heatmap analysis:
- Click Maps: These are perhaps the most common type, visually displaying where visitors click on a page. Hotter areas indicate more clicks, allowing you to instantly analyze website clicks and see which buttons, links, or even non-clickable elements grab attention. This is essential for identifying dead clicks or elements that users expect to be interactive.
- Scroll Maps: A scroll map shows you how far down visitors scroll on your pages. This helps you understand content visibility and placement effectiveness. If your critical content or calls-to-action are in a "cold" zone, it's a clear indicator that they need to be moved higher up or made more engaging to capture attention.
- Move Maps (Hover Maps): These maps track mouse movements, often correlating strongly with eye-tracking (though not perfectly). They reveal where users' attention is drawn, even if they don't click. This offers insights into "ghost" elements that users interact with visually but not via click, and can help optimize your website design for visual flow. These are sometimes referred to as attention maps.
- Confetti Maps: A more granular version of click maps, confetti maps display individual clicks as dots, with each dot often color-coded to represent a different attribute, like referral source or browser type. This allows for deep segmentation and helps you understand visitor clicks from specific user groups.
Each type contributes to a holistic understanding of user engagement, enabling you to pinpoint specific areas for improvement. Bornneo.Lab utilizes these diverse Heatmap tools to provide clients with a comprehensive view of their site's effectiveness.
Transforming Data into Action: How to Interpret Heatmaps

Collecting heatmap data is only the first step; the real value comes from learning how to interpret heatmaps and translating those insights into actionable improvements. This process is central to effective conversion rate optimization (CRO) and enhancing website performance.
- Identify High-Engagement Areas: Look for the "hot" spots. What elements are getting the most clicks or hovers? Are these the elements you *want* users to engage with? If your primary call-to-action isn't hot, it signals a problem with its placement, design, or messaging.
- Uncover Low-Engagement Areas: "Cold" spots are equally important. Are crucial pieces of content or important links being ignored? A low score on a scroll map for content below the fold indicates users aren't finding enough value to continue exploring. This might mean you need to redesign the top section of your page or adjust your content strategy.
- Spot "Dead Clicks": These are clicks on non-clickable elements (like images or static text) that users mistakenly believe are interactive. Identifying dead clicks helps you identify broken elements on website or misleading visual cues, improving the clarity of your website design.
- Analyze Form Interactions: Heatmaps can show where users drop off in forms, highlighting problematic fields or confusing layouts. This is invaluable for streamlining conversion funnels.
- Optimize Calls-to-Action (CTAs): By seeing exactly where users are clicking, you can refine your CTAs. Are they too low on the page? Is the button color not prominent enough? Heatmaps give you direct feedback to optimize landing pages with heatmaps effectively.
Interpreting heatmaps requires a keen eye and an understanding of your overall goals. It's not just about what's hot or cold, but *why* it's hot or cold in relation to your desired customer journey. For deeper insights into creating effective digital presences, consider reading about How to Choose Between a Custom Build and a Website Template.
Leveraging Heatmaps for Conversion Rate Optimization (CRO)
.webp)
Heatmaps are indispensable for conversion rate optimization (CRO) because they provide direct, visual evidence of friction points and opportunities on your site. When you want to improve website conversion, guesswork is your enemy. Heatmaps replace guesswork with concrete data:
- Refining Layouts: Heatmaps help you validate or challenge your assumptions about content hierarchy. If a critical section isn't getting attention, you can adjust its position, size, or visual prominence. This is vital for ensuring your website design guides users efficiently through your conversion funnels.
- Improving Navigation: By observing click tracking patterns on navigation menus, you can identify confusing labels or underused links. This information helps streamline the user path, making it easier for visitors to find what they're looking for.
- Enhancing Content Effectiveness: A scroll map can tell you if users are consuming your valuable content. If they're dropping off too early, you might need more compelling headings, better formatting, or a more engaging introduction.
- Guiding A/B Testing: Heatmap insights often serve as hypotheses for A/B testing. For example, if a heatmap shows many clicks on an image that isn't a link, you could A/B test making it clickable or replacing it with an actual call-to-action. This structured approach helps you make data-driven website changes.
- Uncovering User Pain Points: Heatmaps help you find user pain points that might otherwise go unnoticed. Misunderstood icons, overlooked offers, or areas where users expect more information can all be highlighted, leading to targeted improvements that enhance the overall user experience (UX).
By consistently applying Website heatmap analysis, businesses can continuously iterate and refine their online presence, leading to significant improvements in engagement and conversion rates. Our team at Bornneo.Lab frequently uses these strategies to help clients achieve their desired outcomes, making their digital marketing strategy more potent. For further reading on foundational elements of an effective website, consider exploring the Difference Between Website Design and Website Development.
Integrating Heatmaps with Other Web Analytics
While powerful on their own, heatmaps are most effective when integrated with other web analytics tools. Services like Google Analytics provide quantitative data (e.g., number of visitors, bounce rate, traffic sources), while heatmaps offer qualitative insights (e.g., *where* visitors click, *how far* they scroll). Combining these perspectives paints a complete picture of your customer journey.
For instance, Google Analytics might show a high bounce rate on a specific landing page. A heatmap of that same page can then reveal *why* – perhaps users are fixated on a non-clickable image, or they aren't scrolling down to the main content. This synergy allows you to truly make data-driven website changes. Without quantitative data, heatmaps lack context; without heatmaps, quantitative data lacks detail about user interaction. Together, they form a robust framework for improving website performance and optimizing your digital marketing strategy.
Choosing the Best Heatmap Software
With numerous options available, selecting the best heatmap software depends on your specific needs, budget, and desired features. Popular Heatmap tools often come bundled with other website optimization tools like session recordings, form analytics, and feedback polls. Some well-regarded solutions include Hotjar, Crazy Egg, and Mouseflow. When evaluating software, consider:
- Ease of Use: How intuitive is the interface for setting up tracking and viewing reports?
- Feature Set: Does it offer click maps, scroll maps, move maps, and other features like session recordings or A/B testing integration?
- Reporting and Data Visualization: Are the reports clear, easy to understand, and shareable?
- Integration Capabilities: Can it easily integrate with your existing analytics platforms (e.g., Google Analytics, CRM)?
- Cost: Does the pricing model align with your traffic volume and budget?
Bornneo.Lab has experience working with various heatmap solutions and can guide you in choosing and implementing the right tools to analyze website clicks and improve your site's overall effectiveness. We help you cut through the noise to get straight to the insights that help you improve website UX with heatmaps. For insights on preparing your site for critical times, consider reading about Preparing Your Website for Busy Periods and Holiday Sales.
Common Mistakes to Avoid in Heatmap Analysis
While Website heatmap analysis is incredibly insightful, it's possible to draw incorrect conclusions if certain pitfalls are not avoided:
- Ignoring Sample Size: Don't base significant decisions on limited data. Ensure you have enough visitor interactions for your heatmaps to be statistically significant. A page with only 10 views won't provide reliable heatmap data.
- Analyzing Too Soon: Allow sufficient time for data collection. Patterns emerge over time, not overnight.
- Focusing Only on "Hot" Spots: While high-activity areas are important, neglecting "cold" spots can mean missing critical issues or opportunities. Low-activity areas might indicate overlooked content or design flaws.
- Misinterpreting Dead Clicks: Not all clicks on non-clickable elements are bad. Sometimes users are just exploring. However, consistent "dead clicks" on a particular image or block of text indicate user expectation that it should be interactive.
- Forgetting About Mobile Users: Always segment your heatmap data by device type. What works on desktop may not work on mobile, and vice-versa. Mobile users interact differently (e.g., tapping instead of hovering), so separate analysis is crucial to understand visitor clicks across all devices.
- Failing to Follow Up with A/B Testing: Heatmaps provide hypotheses. True validation often comes from A/B testing the changes suggested by your heatmap analysis to confirm their positive impact on conversions.
- Lack of Context: Heatmaps don't tell the whole story. Combine them with other analytics, user surveys, and session recordings to get a complete picture of the customer journey.
Avoiding these common mistakes ensures that your efforts in user behavior tracking lead to genuinely impactful and data-driven decisions for your website.
Why choose Bornneo.Lab for Website heatmap analysis?
- 🌟 Client-focused delivery with clear scope, timelines, and measurable outcomes aligned to your business goals.
- 🧩 End-to-end support from discovery and strategy to implementation, documentation, and handover.
- 📌 Practical solutions built to fit your existing stack and team workflow—no unnecessary complexity.
Conversion-Driven Design
We design digital experiences with a clear purpose. Every layout, interaction, and call-to-action is strategically crafted to guide users toward meaningful conversions—whether that means leads, sign-ups, or business inquiries.
Mobile-First & Responsive
With the majority of users accessing websites from mobile devices, we prioritize responsiveness from day one. Our solutions adapt seamlessly across screen sizes while maintaining performance and usability.
SEO & Performance Optimized
We build with technical SEO, site speed, and performance best practices in mind—helping your website earn visibility, trust, and sustainable organic growth.
Bornneo.Lab Client Testimonials
★★★★★ – Sarah L.: Bornneo.Lab's insights into our website's user flow were transformative. Their heatmap analysis helped us restructure our landing page, leading to a noticeable increase in sign-ups. Truly impressive work!
★★★★★ – Michael R.: We approached Bornneo.Lab to understand why our e-commerce checkout had a high drop-off. Their Website heatmap analysis pinpointed exactly where users got stuck, and their proposed changes were simple yet incredibly effective. Our conversion rate has significantly improved.
★★★★★ – Emily D.: The team at Bornneo.Lab made understanding our website data so much easier. The visual reports from their user behavior tracking gave us clear action points, enabling us to make confident decisions about our site's future.
★★★★★ – David K.: Bornneo.Lab helped us make sense of our complex analytics. Their detailed scroll maps showed us that a key piece of information was being overlooked, allowing us to reposition it for maximum impact. They truly helped us improve website UX with heatmaps.
★★★★★ – Jessica P.: Working with Bornneo.Lab on our site optimization was a breeze. They not only provided excellent data visualization but also guided us through implementing changes that boosted our user engagement and overall site performance.
READ ALSO: Why Your Website Needs Automated Booking to Save You Hours Every Week
Frequently Asked Questions about Website Heatmaps
What is the primary benefit of using heatmaps for my website?
The primary benefit is gaining a crystal-clear, visual understanding of how users interact with your website. This user behavior tracking allows you to pinpoint exactly where visitors click, scroll, and focus their attention, helping you to make data-driven website changes that directly improve user experience (UX) and conversions.
Can heatmaps help me identify problems with my website design?
Absolutely. Heatmaps are excellent website optimization tools for uncovering website design issues. For example, click tracking can reveal "dead clicks" on non-interactive elements, indicating design confusion. Scroll maps can show if crucial content is placed too low, suggesting a need for layout adjustment to better capture user engagement.
How do heatmaps contribute to Conversion Rate Optimization (CRO)?
Heatmaps directly contribute to CRO by providing visual insights into what prevents users from converting. By helping you find user pain points, such as overlooked CTAs or confusing form fields, heatmaps enable targeted improvements that streamline the customer journey and ultimately improve website conversion rates.
Are heatmaps difficult to set up and interpret without technical expertise?
While basic setup for Heatmap tools is often user-friendly, interpreting the data effectively to optimize landing pages with heatmaps and drive meaningful change can be complex. That's where experts like Bornneo.Lab come in. We specialize in comprehensive Website heatmap analysis, providing not just the data, but also the strategic recommendations to help you understand visitor clicks and implement effective solutions.
Contact Us
Ready to move forward with clarity and confidence? Get direct insights and tailored recommendations by speaking with our team.
Disclaimer
The information provided in this article is for general informational purposes only and does not constitute technical or business advice. Bornneo.Lab recommends consulting with experienced web development professionals for solutions tailored to your specific needs.
```